Terreno Realty (TRNO)·Q4 2025 Earnings Summary
Terreno Realty Beats on Revenue and FFO as Lease Termination Fees Boost Q4
February 5, 2026 · by Fintool AI Agent
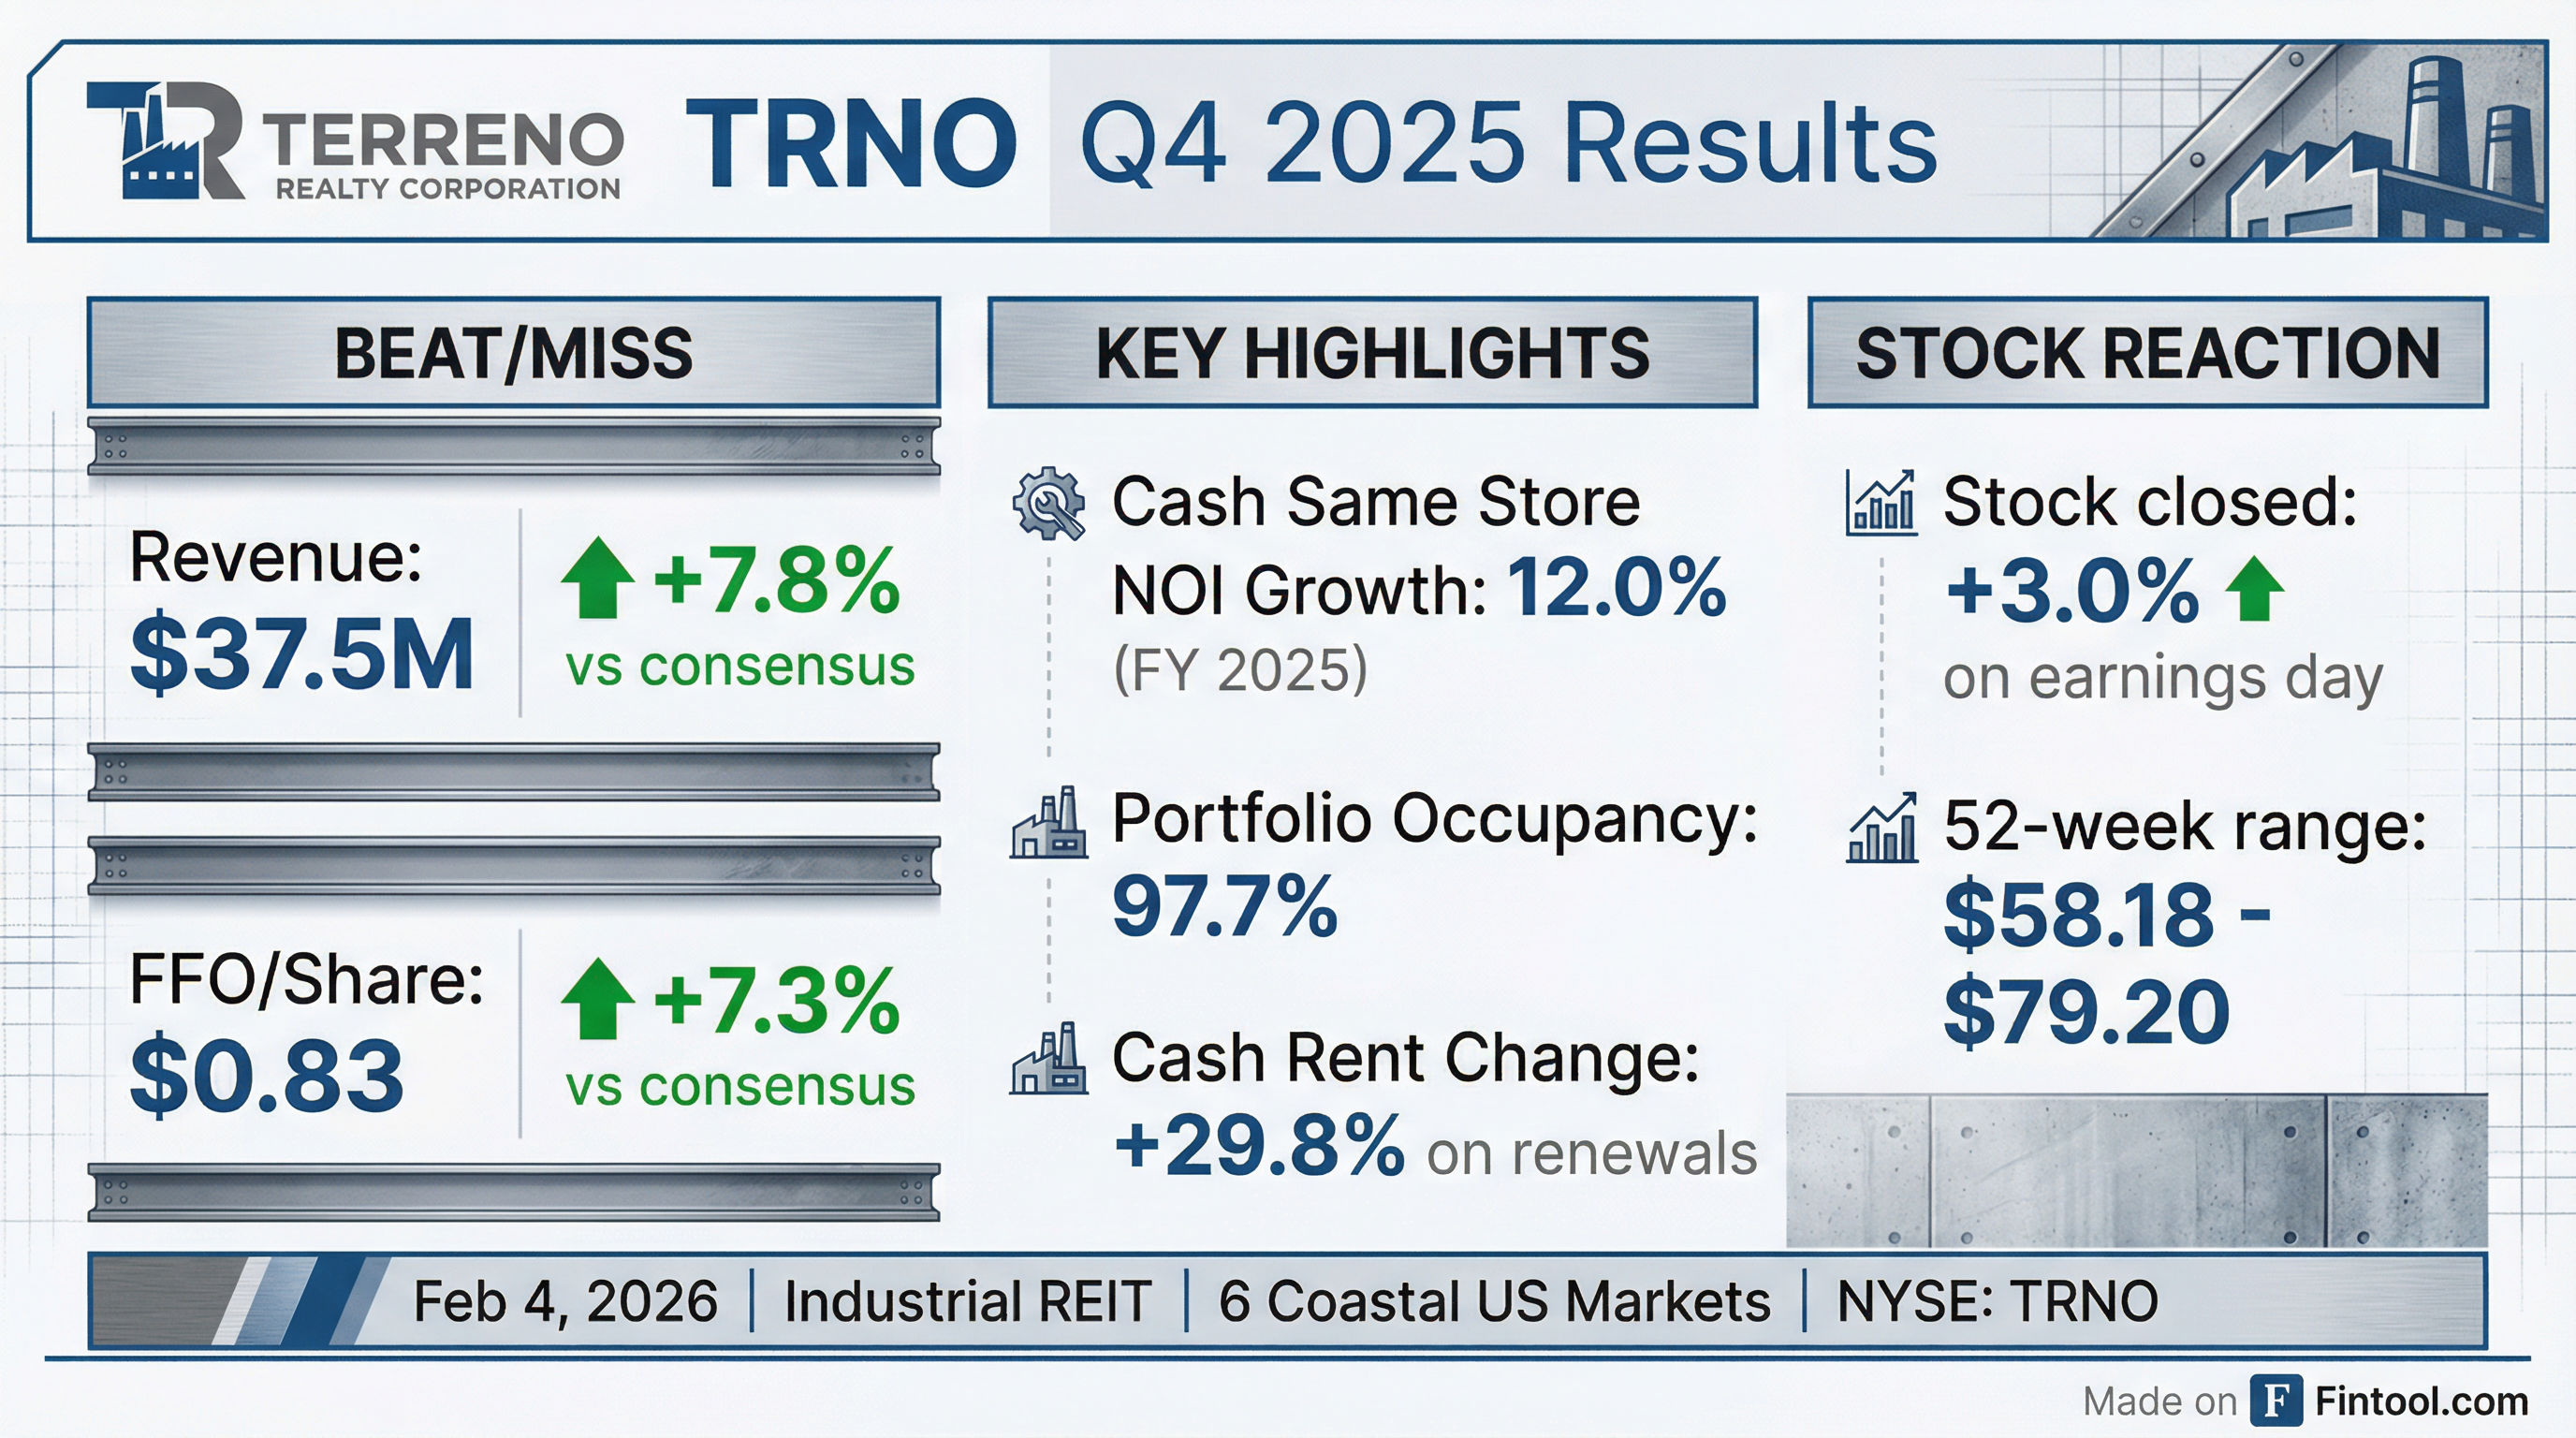
Terreno Realty Corporation (NYSE: TRNO) delivered a strong Q4 2025, beating analyst expectations on both revenue and FFO per share. Revenue came in at $137.5M, 7.8% above the $127.6M consensus estimate, while FFO per share of $0.83 exceeded the $0.77 consensus by 7.3%. The industrial REIT focused on coastal U.S. markets saw its shares rise 3.0% on the day of the earnings release.
The outperformance was driven by $18.4M in lease termination income, strong same store NOI growth, and continued acquisition activity. Management highlighted the company's disciplined infill strategy, with 42% of the portfolio in shrinking supply submarkets that offer structural tailwinds.
Did Terreno Realty Beat Earnings?
Yes — both revenue and FFO beat consensus estimates.
The strong beat was significantly boosted by $18.4M in lease termination income during the quarter. This included $13.8M in termination fees from leases that ended, plus $5.8M from below-market lease write-offs, partially offset by a $1.3M fee paid for a lease buyout.
Excluding termination fees, cash same store NOI grew 4.0% in Q4 and 6.4% for full year 2025 — still solid but highlighting the one-time nature of the Q4 upside.
How Did the Stock React?
Shares of TRNO closed at $64.44 on February 4, 2026, up $1.90 (+3.0%) on the day of the earnings release. The stock is now trading:
- +5.4% above its 50-day moving average ($61.13)
- +10.2% above its 200-day moving average ($58.49)
- -6.9% below its 52-week high of $69.20
The positive reaction reflects investor appreciation for the beat, though some may view the termination fee income as non-recurring. Year-to-date, TRNO has outperformed following a challenging 2024 where the stock fell from $65 highs to $48 lows.
What Changed From Last Quarter?
The sequential improvement was notable across all key metrics. The 160 bps jump in portfolio occupancy to 97.7% demonstrates strong leasing momentum, while the 29.8% cash rent increase on renewals shows pricing power in the company's infill markets.
Full Year 2025 Highlights
For the full year 2025, Terreno delivered exceptional results:
The 11.8% dividend CAGR since 2011 and 10.0% total shareholder return CAGR since the 2010 IPO demonstrate Terreno's track record of value creation.
What Is Terreno's Investment Strategy?
Terreno pursues a focused coastal infill strategy that differentiates it from other industrial REITs:
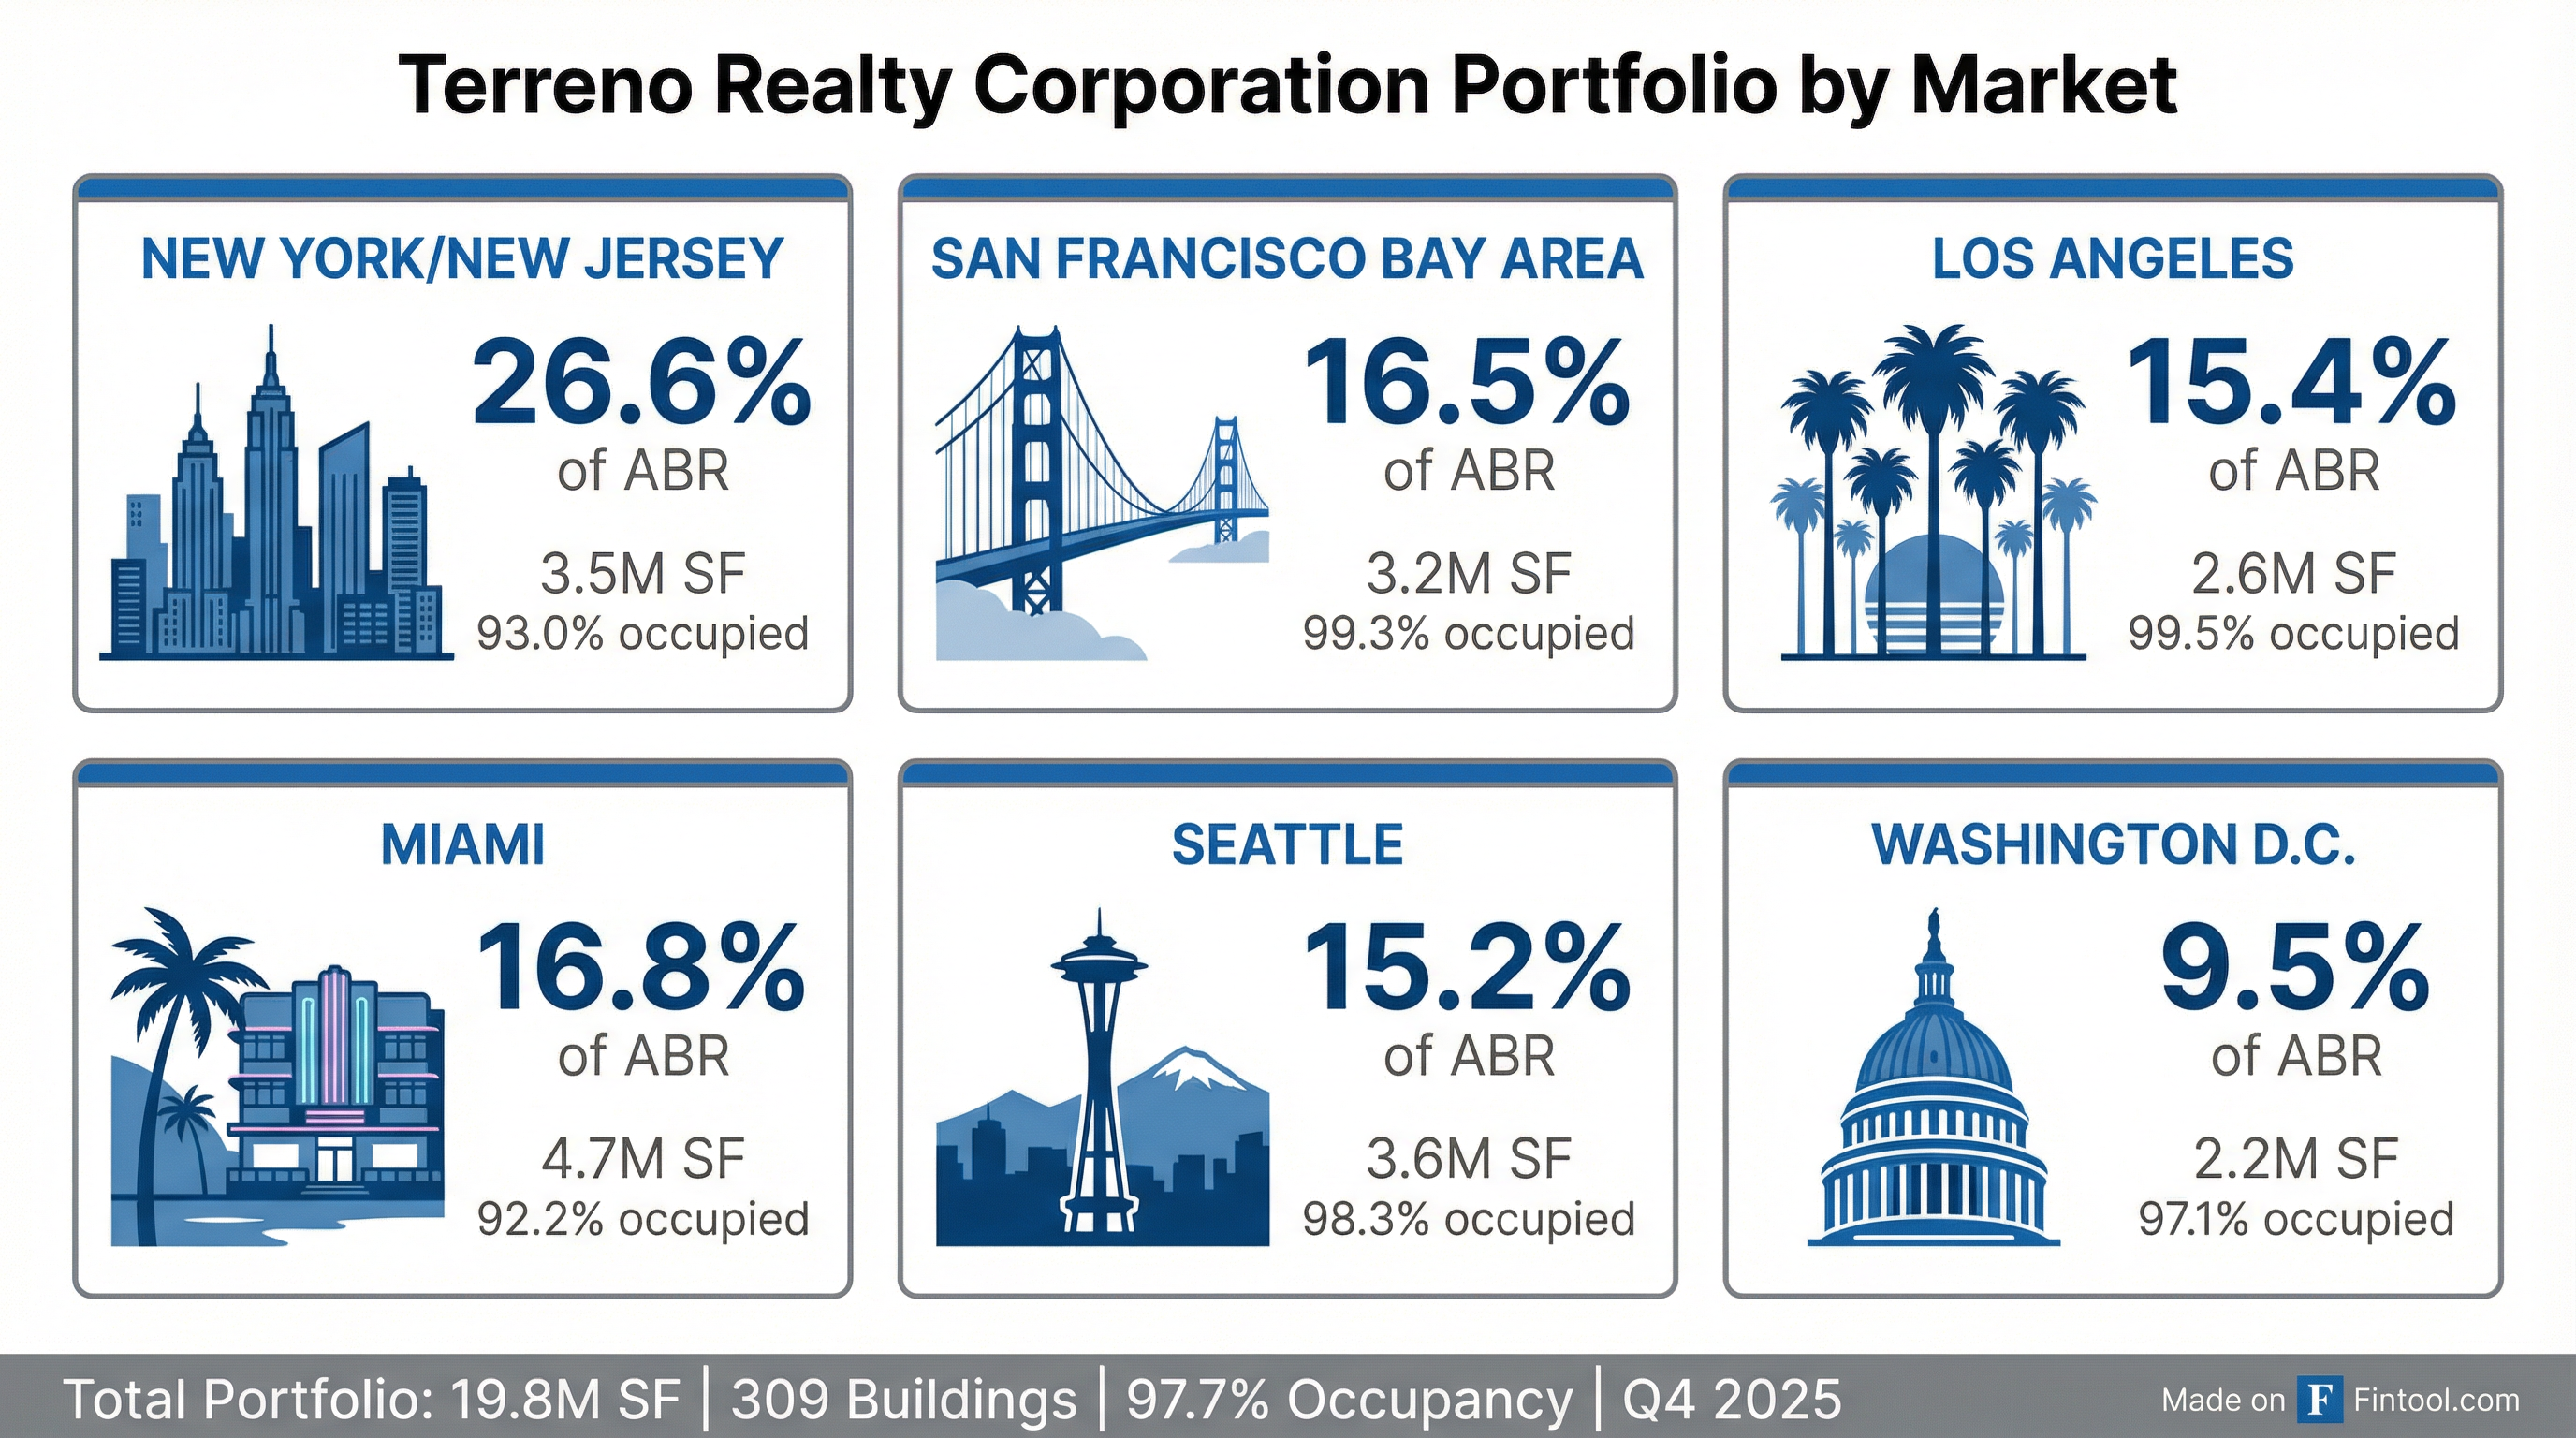
- Six coastal markets only: NYC/New Jersey, Los Angeles, San Francisco Bay Area, Miami, Seattle, and Washington D.C.
- 42% in shrinking supply submarkets: Areas where industrial supply is declining due to urbanization and rezoning
- 41% in no net new supply submarkets: Older infill areas with redevelopment opportunities
- Highest population density: 15,750 people per square mile within 5 miles of portfolio vs. 5,200 for peer average
This strategy provides structural tailwinds as these constrained submarkets experience continued rent growth and higher-and-better-use conversion opportunities.
Capital Markets and Balance Sheet
Terreno maintains a conservative balance sheet with investment-grade credit:
Recent capital markets activity:
- Issued 700K shares at $62.27 avg price in Q4 2025 for $43.6M gross proceeds
- Full year 2025: 4.2M shares issued for $281M gross proceeds
- New $200M 5-year term loan issued January 2026 at SOFR + 1.15%
- Revolver balance reduced from $200M at year-end to $50M as of February 3, 2026
The leverage improvement to 2.3x Net Debt/EBITDA reflects the strong NOI growth and disposition activity during the year.
Development Pipeline
Terreno has approximately 1.2M square feet under development or redevelopment with attractive stabilized cap rates:
The 139th Street redevelopment is a major project that is 48.9% pre-leased and represents significant NAV upside upon completion.
Dividend Declared
Terreno declared a quarterly dividend of $0.52 per share for Q1 2026, payable April 10, 2026 to shareholders of record March 27, 2026.
At the current share price of $64.44, this represents an annualized yield of approximately 3.2%. The dividend has grown at an 11.8% CAGR since initiation in 2011.
Key Risks Flagged
Management highlighted several risk factors in their filings:
- Trade policy uncertainty: A decline in economic activity from tariffs and trade policy changes could impact demand
- Interest rate sensitivity: 42.4% floating rate debt exposure creates interest expense variability
- Tenant concentration: Lease terminations, while generating short-term income, require re-leasing
- Development risk: 1.2M SF under development with pre-leasing ranging from 0% to 100%
The high exposure to import/export-driven coastal markets creates sensitivity to trade flows, with 49% of LA/Long Beach imports from China and 20% of NYC/Newark imports from China.
Forward Catalysts
Looking ahead, investors should watch for:
- Development deliveries: Countyline Phase IV (Q1 2026) and Building 32 (Q2 2026) stabilizations
- Leasing progress: 139th Street redevelopment pre-leasing beyond current 48.9%
- Acquisition activity: $113.2M under contract as of earnings date
- Cash rent growth sustainability: Can the 25%+ spreads continue?
- ESG milestones: 1.0M SF LEED certification target for 2026
Bottom Line
Terreno Realty delivered a strong Q4 with beats on both revenue (+7.8%) and FFO (+7.3%), though lease termination income of $18.4M was a significant contributor. The underlying business remains healthy with 97.7% occupancy, 29.8% cash rent spreads, and improving leverage metrics. The focused coastal infill strategy continues to generate attractive returns, with an 11.1% average cash same store NOI growth rate since IPO demonstrating the durability of the approach.
For more details, see the full Q4 2025 10-K filing and earnings presentation.
Data sourced from company filings and S&P Global.